- About Us
- Corporate Citizenship
- Corporate Sustainability
Corporate Sustainability Report
Our 2023 annual sustainability report highlights our dedication to ESG objectives. It showcases our unwavering commitment to transparency, sustainable growth and shared values while emphasizing the tireless efforts of our team to foster a culture of diversity, equity and inclusion. To find out more, download a copy of the report today.
The information below represents a summarized, at-a-glance view of our 2023 Sustainability Report: Driving Sustainable Value. The information highlights the 2023-to-baseline year, and year-over-year comparisons, related to our environmental, social and governance sections within the report, in addition to our SASB, TCFD and UN SDG comparison tables. For a complete and more comprehensive view, please download the full document here.
Introduction
Message from our President & CEO

2023 was a pivotal year for our company as we embarked on an exciting rebranding journey. We unveiled a new logo that represents more than just a visual change; it embodies our vision to redefine DNOW both financially and culturally. Our rebranding is driven by our ethos to “inspire one another, delight our customers and fuel the future.” The new logo tells a story of growth, transformation, sustainability, which define the exciting future that lies ahead for DNOW.
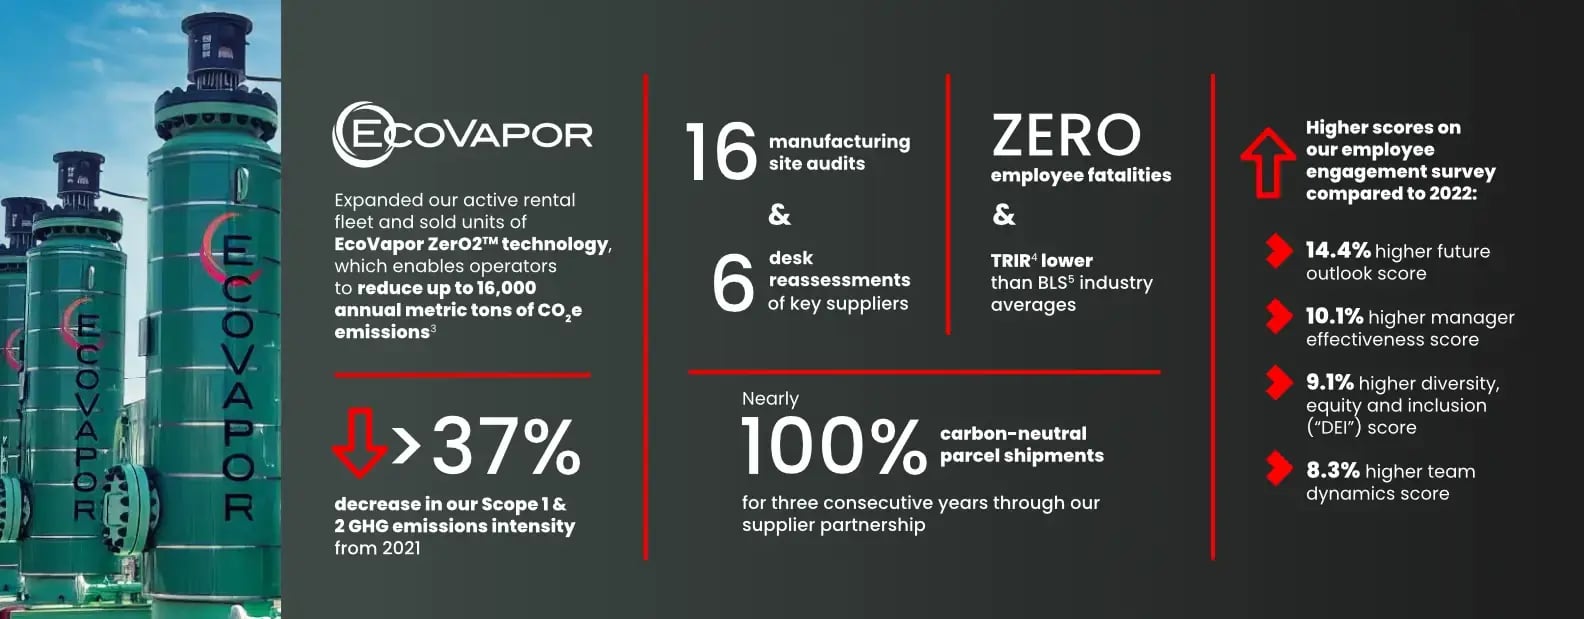
Building on our rebranding momentum, I am pleased to share the highlights of our transformative year in this 2023 Sustainability Report. This past year has been marked by significant achievements and milestones that demonstrate our unwavering commitment to sustainability, growth and creating value for our shareholders. Sustainability remains at the core of our operations, driving both our environmental initiatives and our financial success. Our EcoVapor product continues to play a crucial role in the removal of methane and CO2 emissions by addressing gas contamination issues and minimizing the flaring of methane gas. This innovation not only supports our sustainability goals but also provides tangible benefits to our customers and the environment.
We remain committed to expanding our business while responsibly minimizing our environmental impact. As we continue to focus on Driving Sustainable Value, we are proud to report that in 2023, our total Scope 1 and 2 GHG emissions intensity metrics were the lowest in three years, illustrating a decrease of over 37% from 2021, a solid achievement considering our revenue and activity growth. In 2023, we realized a remarkable 9% year-over-year revenue growth and record earnings, reflecting our strategic focus and the robust demand for our innovative solutions. Additionally, our cash provided by operating activities was $188 million, underscoring our strong operational performance. In line with our commitment to delivering value to our shareholders, we returned cash through our share repurchase program, with $50 million in purchases completed in 2023. These financial accomplishments are a testament to the hard work and dedication of our entire team, all while maintaining our commitment to sustainability and long-term growth.
Furthermore, our dedication extends beyond financial and environmental achievements to fostering an exceptional workplace culture. I am proud of all our employee engagement initiatives and the culture we are building upon to ultimately provide world-class customer service to our customers. Our employee engagement survey results are a testament to what we have built, including higher scores in future outlook, manager effectiveness, diversity, equity and inclusion and team dynamics. We also continue to be a bright light in our communities. Complementing these internal achievements, our DNOW Lights initiative had a record year of events and volunteering, highlighting our commitment to giving back to the community and fostering a culture of service and engagement among our employees.
As we look forward to the future, we remain committed to our core values of innovation, sustainability and operational excellence. We will continue to seek opportunities to enhance our ESG performance and Drive Sustainable Value.
Governance

8Diverse indicates directors that are female and/or a member of an underrepresented racial/ethnic group. Board diversity is as of December 31, 2023.
9When performing a desk reassessment, we perform an offsite re-audit, whereby we review the manufacturers’ processes and documentation. Key suppliers are strategic partners that are in our approved manufacturers list with which we have top spend and other suppliers of products we deem critical.
DNOW’s Board of Directors and management acknowledge that a strong governance structure is foundational for fostering an accountable business culture, upholding high standards of ethical conduct and ensuring sustainable stakeholder value creation. Maintaining stakeholder trust and goodwill by upholding our ethical standards and adhering to high controls in both policies and performance remains a centralized focus of our company. We are committed to being responsive to and engaging with our stakeholders on operational, financial, governance, environmental, safety and social matters to create a layer of transparency which ensures consistency in our implementation and enforcement of our approach model to gain commitment and buy-in.
Social

Our safety culture is a cornerstone of how we Drive Sustainable Value for our stakeholders. At DNOW, we integrate health, safety and environmental practices into our business model – from day-to-day operations to the integration of business acquisitions, as well as measuring and assessing results while continually improving processes. Our safety culture is instilled as a core value of our organization first and foremost at the leadership level, including engagement from executives, our Board and operational leaders. We take a proactive approach to safety and are continuously working to adapt our safety topics and priorities to the needs of specific business segments and regions.
Environment

21See Page 23 for further details.
22As of December 31, 2023, over 30 equipment skids were installed at 28 RNG sites across the U.S. These units can process 9 million standard cubic feet of biogas daily, enabling our customers to cut 480,000 MT CO2e emissions annually. See Page 42 for further details.
Our goal is to assume a vital position and seamlessly integrate within our customers’ value chain while prioritizing our focus on environmental responsibility. We are actively working on our energy management, conservation initiatives, responsible water usage and recycling whenever applicable to reduce our operational footprint. This commitment is firmly established in our Environmental Policy Statement.
We prioritize addressing our customers’ unique energy evolution demands and risks while maximizing value in emerging markets. Our customers face increasing demands to minimize their environmental impact and rely on us for tailored products and process solutions that harmonize with their environmental initiatives and sustainability goals. This includes offering products and services that aid in curtailing environmental footprint, mitigating GHG emissions and fostering sustainable waste and water management practices.
About This Report
The information included in this report is subject to DNOW’s policies and requirements surrounding the disclosure of financial and non-financial data. The financial information included in this report was sourced from our Form 10-K filed with the SEC on February 15, 2024. All non-financial data included in this report was not subject to a third-party audit verification process.Basis of Presentation for Emissions
DNOW has prepared our GHG emissions calculations for the year ended December 31, 2023 in accordance with the World Resources Institute and World Business Council for Sustainable Development’s Greenhouse Gas Protocol standards and guidance (collectively, the GHG Protocol):
- Scope 1 emissions have been prepared in accordance with the GHG Protocol Corporate Accounting and Reporting Standard (revised edition)
- Scope 2 emissions have been prepared in accordance with the GHG Protocol Scope 2 Guidance: An amendment to the GHG Protocol Corporate Standard
We present our emissions under the operational control approach, accounting for emissions from operations over which we have the full authority to introduce and implement our operating policies.
Use of Estimates and Estimation Uncertainties
The presentation of non-financial data within this report requires management to make estimates and assumptions that affect data reported within this report. DNOW bases our estimates and methodologies on historical experience and trends, available information and various other assumptions that we believe to be reasonable. Emissions data presented is subject to measurement and uncertainties resulting from limitations inherent in the nature and methods used for determining such data. The selection of different but acceptable measurement techniques can result in materially different measurements. The precision of different measurement techniques may also vary. DNOW nor their affiliates or representatives make any representation or warranty (express or implied) with respect to the information contained in this report (including, without limitation, information obtained from third parties) and each of DNOW and their respective affiliates and representatives expressly disclaim any and all liability based on or relating to the information contained in, or errors or omissions from this report, based on or relating to the reader of this report, or any other written or oral communications transmitted to the readers of this report.
Forward-Looking Statements
Certain information contained in this Sustainability Report may constitute forward-looking statements within the meaning of applicable securities laws, including, but not limited to, statements regarding our plans to: move forward with identified climate change opportunities, foster programs regarding diversity and inclusion and plans to seek opportunities to further integrate sustainability factors into investment decisions. Readers are cautioned not to place undue reliance on forward-looking statements, as they are subject to a number of assumptions and known and unknown risks and uncertainties that may cause the actual results, performance or achievements of DNOW to be materially different from any future results, performance or achievements expressed or implied by such forward-looking statements. The forward-looking statements contained herein are made as of the date of this document. We also describe risks and uncertainties in our reports filed with the SEC, including our Form 10-K for the year-ended December 31, 2023 (under the headings “Risk Factors” and “Information Regarding Forward Looking Statements” and elsewhere) and our subsequent reports, which are available through the SEC’s EDGAR system at www.sec.gov, and on our website at www.dnow.com. DNOW assumes no obligation to update or otherwise revise these forward-looking statements, whether as a result of new information, future events or otherwise.
SASB Index
The Sustainability Accounting Standards Board (“SASB”) framework aims to provide a standard for companies to disclose financially-material and decision useful ESG information to investors and other stakeholders. The index below maps our performance under each of the suggested disclosure topics for the following two industries:
- Oil & Gas Services (Code EM-SV)
- Multiline and Specialty Retailers & Distributors (Code CG-MR)
According to SASB’s Sustainable Industry Classification System (SICS®), these two industry standards most accurately reflect our business operations. Other topics disclosed throughout this report beyond the scope of these standards are not reflected in this index.
| Code | Accounting Metric | Unit of Measure | 2023 Response | 2022 Response | 2021 Response |
| Greenhouse Gas Emissions | |||||
| EM-SV-110a.1 | Total fuel consumed | Gigajoules (GJ) | 224,011 | 216,873 | 248,228 |
| Metric tons carbon dioxide equivalent (MT CO2e) | 15,682 | 15,402 | 16,624 | ||
| Percentage renewable | Percentage (%) | 0% | 0% | 0% | |
| Percentage used in on-road equipment and vehicles | Percentage (%) | 99.9% | 99.8% | 99.8% | |
| Percentage used in off-road equipment | Percentage (%) | 0.01% | 0.2% | 0.2% | |
| EM-SV-110a.2 | Discussion of strategy or plans to address air emissions-related risks, opportunities, and impacts | N/A | Pages 49 | See 2022 Report | See 2021 Report |
| Energy Management | |||||
| CG-MR-130a.1 | Total electricity consumed | Gigajoules (GJ) | 59,868 | 60,470 | 69,358 |
| Metric tons carbon dioxide equivalent (MT CO2e) | 7,629 | 7,896 | 8,247 | ||
| Total natural gas consumed | Gigajoules (GJ) | 76,194 | 74,891 | 112,104 | |
| Metric tons carbon dioxide equivalent (MT CO2e) | 3,900 | 3,841 | 5,683 | ||
| Total energy consumed | Gigajoules (GJ) | 136,062 | 135,361 | 181,462 | |
|
Percentage energy consumed that is grid electricity1 |
Percentage (%) | 44% | 45% | 38% | |
| Employee Health & Safety | |||||
| EM-SV-320a.1 | Total recordable incident rate (TRIR) | Rate | 0.81 | 0.94 | 0.92 |
| Fatality rate | Rate | 0 | 0 | 0 | |
| Near miss frequency rate (NMFR) | Rate | Not Disclosed | Not Disclosed | Not Disclosed | |
| Total vehicle incident rate (TVIR) | Rate | 0.43 | 1.17 | 0.56 | |
| Average hours of health, safety, and emergency response training for (a) full- time employees, (b) contract employees, and (c) short- service employees | Hours | Not available | Not available | Not available | |
| EM-SV-320a.2 | Description of management systems used to integrate a culture of safety throughout the value chain and project lifecycle | N/A | Pages 29 | See 2022 Report | See 2021 Report |
| Labor Practices | |||||
| CG-MR-310a.3 | Total amount of monetary losses as a result of legal proceedings associated with labor law violations | Dollars ($) | $0 | See 2022 Report | See 2021 Report |
| Employee Engagement, Diversity & Inclusion | |||||
| CG-MR-330a.1 | Percentage of gender and racial/ethnic group representation for (1) management and (2) all other employees | Percentage (%) | Page 36 | See 2022 Report | See 2021 Report |
| CG-MR-330a.2 | Total amount of monetary losses as a result of legal proceedings associated with employment discrimination | Dollars ($) | $0 | See 2022 Report | See 2021 Report |
| Data Security | |||||
| CG-MR-230a.1 | Description of approach to identifying and addressing data security risks | N/A | Page 25 | See 2022 Report | See 2021 Report |
| CG-MR-230a.2 | Number of data breaches | Number | 0 | 0 | 0 |
| Percentage involving personally identifiable information | Percentage (%) | 0% | 0% | 0% | |
| Number of customers affected | Number | 0 | 0 | 0 | |
| Business Ethics | |||||
| EM-SV-510a.1 | Amount of net revenue in countries that have the 20 lowest rankings in Transparency International’s Corruption Perception Index | Percentage (%) of Total Revenues | 0.04% | 0.23% | 0.15% |
| EM-SV-510a.2 | Description of the management system for prevention of corruption and bribery throughout the value chain | N/A | Page 20 | See 2022 Report | See 2021 Report |
| Critical Incident Risk Management | |||||
| EM-SV-540a.1 | Description of management systems used to identify and mitigate catastrophic and tail-end risks | N/A | Page 16 | See 2022 Report | See 2021 Report |
| Product Design & Lifecycle Management | |||||
| CG-MR-410a.1 | Revenue from products third-party certified to environmental and/or social sustainability standards | Dollars ($) | Not available | Not available | Not available |
| CG-MR-410a.3 | Discussion of strategies to reduce the environmental impact of packaging | N/A | Pages 23 | See 2022 Report | See 2021 Report |
| Management of the Legal & Regulatory Environment | |||||
| EM-SV-530a.1 | Discussion of corporate positions related to government regulations and/or policy proposals that address environmental and social factors affecting the industry | N/A | Pages 19 | See 2022 Report | See 2021 Report |
| Activity Metrics | |||||
| CG-MR-000.A | Number of retail locations | Number | 155 | 170 | 180 |
| Number of regional fulfillment centers | Number | 10 | 9 | 8 | |
| CG-MR-000.B | Total area of retail space | Square meters (m2) | 247,613 | 267,629 | 254,958 |
| Total area of regional fulfillment centers | Square meters (m2) | 95,169 | 91,552 | 87,836 | |
1 Calculated as purchased grid electricity consumption divided by total energy consumption, which includes natural gas consumption.
TCFD Index
We are committed to increasing transparency and alignment of our reporting with the recommendations established by the Task Force on Climate- Related Financial Disclosures (“TCFD”). The TCFD developed voluntary, consistent climate-related financial risk disclosures for use in providing information to stakeholders. Below is a summary of these disclosures in this report.
| Category | TCFD Recommendation | Supporting Recommended Disclosure | Location of Disclosure |
|---|---|---|---|
| Governance | Disclose the organization’s governance around climate-related risks and opportunities. | a) Describe the board’s oversight of climate-related risks and opportunities. | Corporate Governance Oversight, Page 13 |
| b) Describe management’s role in assessing and managing climate-related risks and opportunities. | |||
| Strategy | Disclose the actual and potential impacts of climate-related risks and opportunities on the organization’s businesses, strategy and financial planning where such information is material. | a) Describe the climate-related risks and opportunities the organization has identified over the short-, medium- and long-term. | Managing Risks & Opportunities, Page 16 Management of the Legal & Regulatory Environment, Page 19 |
| b) Describe the impact of climate-related risks and opportunities on the organization’s businesses, strategy and financial planning. | |||
| c) Describe the resilience of the organization’s strategy, taking into consideration different climate-related scenarios, including a 2°C or lower scenario. | At this time, DNOW has not conducted a 2°C or lower scenario analysis. We are, however, committed to continuing to enhance our understanding of climate- related risks and opportunities and the ways in which they impact our business, strategy and financial planning, and will assess this initiative in the future. | ||
| Risk Management | Disclose how the organization identifies, assesses and manages climate-related risks. | a) Describe the board’s oversight of climate-related risks and opportunities. | Managing Risks & Opportunities, Page 16 |
| b) Describe the organization’s processes for managing climate-related risks. | |||
| c) Describe how processes for identifying, assessing and managing climate-related risks are integrated into the organization’s overall risk management. | |||
| Metrics & Targets | Disclose the metrics and targets used to assess and manage relevant climate- related risks and opportunities where such information is material. | a) Disclose the metrics used by the organization to assess climate-related risks and opportunities in line with its strategy and risk management process. | SASB Index, Page 53 |
| b) Disclose Scope 1, Scope 2 and, if appropriate, Scope 3 GHG emissions and the related risks. | |||
| c) Describe the targets used by the organization to manage climate-related risks and opportunities and performance against targets. | We have not yet set climate-specific targets, as we’re focused on establishing our GHG emissions baseline and enhancing our approach to ESG data collection. We will continue to evaluate the feasibility and relevance of setting climate-specific targets in the future. |
UNSDG Alignment
| UN SDG | DNOW Goal Progress and Key Performance Indicators | Section, Page # |
 |
|
Workforce Health & Safety, Page 29 |
 |
|
Employee Engagement & Development, Page 32 |
  |
|
Corporate Governance Oversight, Page 13 Workforce Diversity & Inclusion, Page 34 |
    |
|
Supply Chain Stewardship, Page 21 Delivering Sustainable Energy, Page 42 DNOW Environmental Performance, Page 49 Managing Risks & Opportunities, Page 16 |
 |
|
Corporate Governance Oversight, Page 13 Business Ethics & Payments Transparency, Page 20 Management of the Legal & Regulatory Environment, Page 19 |
 |
|
Our Sustainability Reporting Framework, Page 9 |


